Another gardening automation using microcontrollers
Table of contents
Background
Like probably 99% of the people playing with microcontrollers, I, at some point wanted to automate my gardening, or at least collect some data about it.
My overall idea would be to have a wyswig interface to create automation rules, and a dashboard to visualize my data. On the long term I would probably look into controlling my watering system using a PID controller, and define some rules based on the plants I am growing.
For now, this project will mainly focus on collecting data and visualizing it, in a manner that would be easy to extend in the future.
Hardware
This project will require a microcontroller with a wifi interface. As we plan to write our data to a database, we will need to be able to connect to our wifi network. I am using an ESP32, but an ESP8266 would probably work as well.
There have been a lot of soil moisture sensors out there, and most of the one I tested were.. well.. crappy. However, I found (chirp)[https://wemakethings.net/chirp/] a few years ago. Chirp is a capacitive stand alone soil moisture sensor, that works on a 3V CR2032 battery. It works as it is and simply beeps when the soil is dry. I have had a chirp running for years now without any real issue. As an extra bonus, chirp is totally hackable, and can be used as an I2C slave.
Software
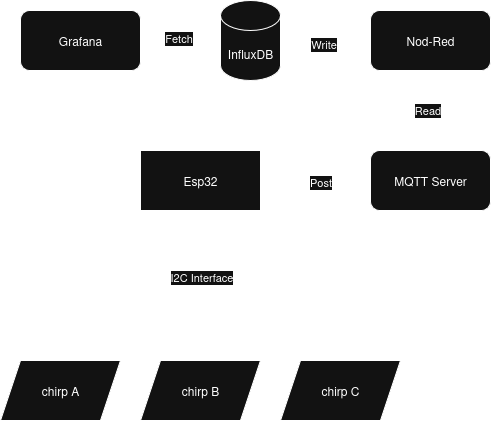
Figure 1: The Flow diagram of the data for our gardening project
In this section we will have to install a lot of tools. As I already had a server running with especially a lot of docker containers, I decided to stick to it and use docker containers for this project. If by anychance you are not familiar with docker or want a nice interface to manage your containers, I highly recommend you to check out (portainer)[https://www.portainer.io/].
Node-RED
As I wanted a wyswig interface to create automation rules, I decided to use Node-RED. Node-RED is a flow-based programming tool for wiring together hardware devices, APIs and online services. It provides a browser-based editor that makes it easy to wire together flows using the wide range of nodes in the palette.
InfluxDB
InfluxDB is a really simple open-source non relational database, that is optimized for time series data. It is really easy to use and has a lot of features that make it perfect for our use case.
Grafana
Grafana is an open-source platform for monitoring and observability. It allows you to query, visualize, alert on, and understand your metrics no matter where they are stored. Grafana provides a powerful and flexible way to create dashboards and visualizations of your data.
MQTT
MQTT is a lightweight, publish-subscribe network protocol that transports messages between devices. I like to see mqtt as a sort of forum where devices can post messages to topics, and other devices can subscribe to these topics to receive the messages. In our case, the ESP32 will publish the data it collects from the chirp sensor to a topic, and Node-RED will subscribe to this topic to receive the data.
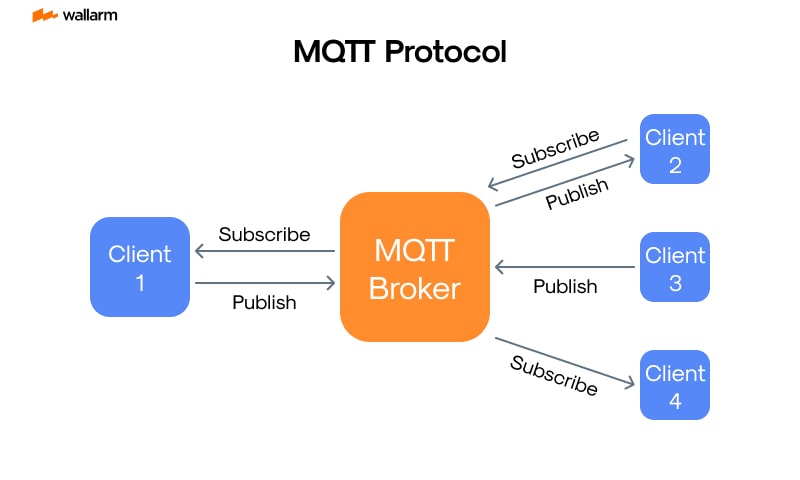
Figure 2: Representation of the MQTT protocol. source: (wallarm)[https://www.wallarm.com/what/mqtt-concept]
Writting our compose file
As we want to put everything together through different docker containers, we will use docker-compose to manage our containers. Let’s go through the different services step by step.
mqtt aka mosquitto
First we need a mqtt broker. I am using mosquitto, which is a really simple and easy to use mqtt broker. We will use the official mosquitto image from docker hub.
1
2
3
4
5
6
7
8
9
10
11
12
13
    mosquitto:
      image: eclipse-mosquitto:latest
    container_name: mosquitto
    restart: unless-stopped
    ports:
      - "1883:1883"   # MQTT
      - "9001:9001"   # Websocket (optional)
    volumes:
      - <YOUR_CONFIG_PATH>:/mosquitto/config
      - <YOUR_LOG_PATH>:/mosquitto/log
    networks:
      - water_gardening_net
As everything runs in a container, we need to mount our configuration file and log file to the container.
Please also note that we are using a custom network for our containers. By putting all our services in the same network, they will be able to communicate with each other through their container name.
node-red
Next we need to set up Node-RED. We will use the official Node-RED image from docker hub.
1
2
3
4
5
6
7
8
9
10
11
12
13
14
15
    node-red:
      image: nodered/node-red:latest
      container_name: node-red
      restart: unless-stopped
      ports:
        - "1880:1880"   # Node-RED
      volumes:
        - <YOUR_DATA_PATH>:/nodered/data
      environment:
        - TZ=Europe/Paris
      networks:
        - water_gardening_net
      depends_on:
        - mosquitto
        - influxdb
influxdb
Now comes the influxdb service. We will use the official influxdb image from docker hub.
1
2
3
4
5
6
7
8
9
10
11
12
13
14
15
16
17
18
19
    influxdb:
    image: influxdb:latest
    container_name: influxdb
    restart: unless-stopped
    ports:
      - "8086:8086"   # InfluxDB UI/API
    volumes:
      - influxdb-data:/influxdb/data
      - influxdb-config:/influxdb/config

    environment:
      - DOCKER_INFLUXDB_INIT_MODE=setup
      - DOCKER_INFLUXDB_INIT_USERNAME=${INFLUXDB_USER}
      - DOCKER_INFLUXDB_INIT_PASSWORD=${INFLUXDB_PASSWORD}
      - DOCKER_INFLUXDB_INIT_ORG=${INFLUXDB_ORG}
      - DOCKER_INFLUXDB_INIT_BUCKET=${INFLUXDB_BUCKET}

    networks:
      - water_gardening_net
Here we are using environment variables to set up the initial user, password, organization and bucket. You will need to set these variables in a .env file in the same directory as your docker-compose file.
grafana
Finally we need to set up Grafana. We will use the official Grafana image from docker hub.
1
2
3
4
5
6
7
8
9
10
11
12
    grafana:
      image: grafana/grafana:latest
      container_name: grafana
      restart: unless-stopped
      ports:
        - "3000:3000"   # Grafana
      volumes:
        - grafana-data:/grafana/data
      networks:
        - water_gardening_net
      depends_on:
        - influxdb
(optional) ESPHome
If you want to use ESPHome to program your ESP32 instead of writing C like code, you can add the following service to your docker-compose file.
1
2
3
4
5
6
7
8
9
    esphome:
        image: esphome/esphome:latest
        container_name: esphome
        restart: unless-stopped
        network_mode: "host"  # required for OTA flashing
        volumes:
        - ./esphome/config:/config
        stdin_open: true
        tty: true
Please note, that ESPhome doesn’t need to be in the same network as the other services, as it will only be used to flash the ESP32 over the air.
Defining the volumes and networks
Finally, we need to define the volumes and networks at the end of our docker-compose file.
1
2
3
4
5
6
7
8
9
10
11
12
13
volumes:
  mosquitto-data:
  mosquitto-conf:
  mosquitto-log:
  nodered-data:
  influxdb-data:
  influxdb-config:
  grafana-data:

networks:
  water_gardening_net:
    driver: bridge
Putting everything together
Here is the complete docker-compose file:
1
2
3
4
5
6
7
8
9
10
11
12
13
14
15
16
17
18
19
20
21
22
23
24
25
26
27
28
29
30
31
32
33
34
35
36
37
38
39
40
41
42
43
44
45
46
47
48
49
50
51
52
53
54
55
56
57
58
59
60
61
62
63
64
65
66
67
68
69
70
71
72
73
74
75
76
77
78
79
80
81
82
83
84
85
86

services:
  mosquitto:
      image: eclipse-mosquitto:latest
    container_name: mosquitto
    restart: unless-stopped
    ports:
      - "1883:1883"   # MQTT
      - "9001:9001"   # Websocket (optional)
    volumes:
      - <YOUR_MOSQUITTO_CONFIG_PATH>:/mosquitto/config
      - <YOUR_MOSQUITTO_LOG_PATH>:/mosquitto/log
    networks:
      - water_gardening_net

  nodered:
    image: nodered/node-red:latest
    container_name: nodered
    restart: unless-stopped
    ports:
      - "1880:1880"   # Node-RED editor UI
    volumes:
      - <YOUR_NODERED_DATA_PATH>:/nodered/data
    depends_on:
      - mosquitto
      - influxdb
    networks:
      - water_gardening_net

  influxdb:
    image: influxdb:latest
    container_name: influxdb
    restart: unless-stopped
    ports:
      - "8086:8086"   # InfluxDB UI/API
    volumes:
      - <YOUR_INFLUXDB_DATA_PATH>:/influxdb/data
      - <YOUR_INFLUXDB_CONFIG_PATH>:/influxdb/config

    environment:
      - DOCKER_INFLUXDB_INIT_MODE=setup
      - DOCKER_INFLUXDB_INIT_USERNAME=${INFLUXDB_USER}
      - DOCKER_INFLUXDB_INIT_PASSWORD=${INFLUXDB_PASSWORD}
      - DOCKER_INFLUXDB_INIT_ORG=${INFLUXDB_ORG}
      - DOCKER_INFLUXDB_INIT_BUCKET=${INFLUXDB_BUCKET}

    networks:
      - water_gardening_net

  grafana:
    image: grafana/grafana:latest
    container_name: grafana
    restart: unless-stopped
    ports:
      - "3000:3000"   # Grafana UI
    volumes:
      - <YOUR_GRAFANA_DATA_PATH>:/grafana/data
    depends_on:
      - influxdb
    networks:
      - water_gardening_net

  esphome:
    image: esphome/esphome:latest
    container_name: esphome
    restart: unless-stopped
    network_mode: "host"  # required for OTA flashing
    volumes:
      - <YOUR_ESP_HOME_CONFIG_PATH>:/config
    stdin_open: true
    tty: true


volumes:
  mosquitto-data:
  mosquitto-conf:
  mosquitto-log:
  nodered-data:
  influxdb-data:
  influxdb-config:
  grafana-data:

networks:
  water_gaderning_net:
    driver: bridge
Once gathered you should be able to start your services by running:
1
docker-compose up -d
Preparing each service
Now that everything is up and running, we need to prepare each service.
node-red
First we connect to the Node-RED editor by going to http://YOUR_SERVER_IP:1880
In there we will create a simply flow that reads data from the mqtt broker and writes it to the influxdb database.
We will start with installing the required nodes. Go to the menu in the top right corner and select “Manage palette”. In the “Install” tab, search for “node-red-contrib-influxdb” and install it. Then search for “node-red-contrib-mqtt-broker” and install it as well.
Now we can create our flow. Drag and drop the following nodes to the editor:
- mqtt in
- influxdb out
- debug
The debug node is optional, but it is always useful to have it to see what is going on.
Connect the nodes as shown in the figure below:
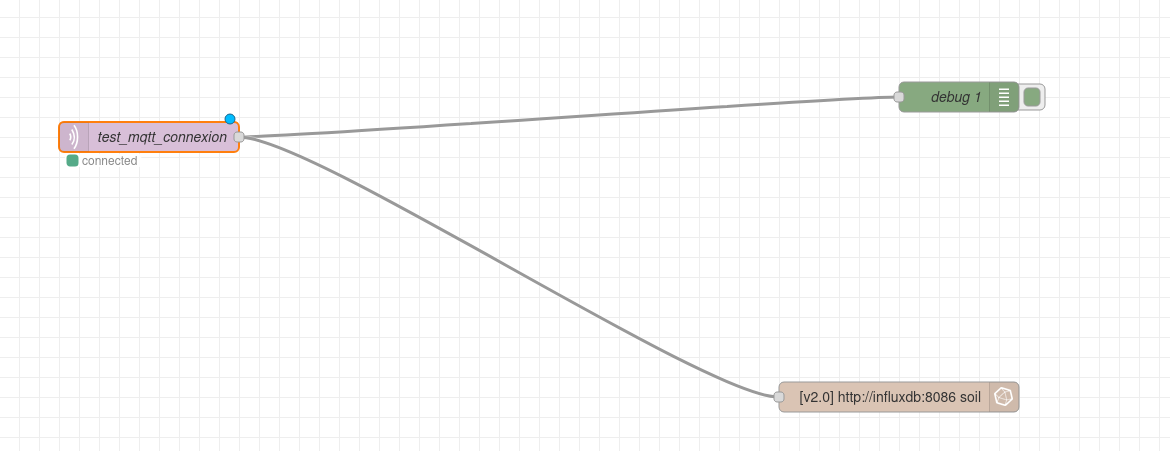
Figure 3: The Node-RED flow to read data from the mqtt broker and write it to the influxdb database
I personally renamed the nodes to have a better overview of what is going on.
Now we can configure each node. Double click on the mqtt in node to open the configuration window. In there, we will set the following parameters:
- server: click on the pencil icon to add a new server
- server: mosquitto (the container name of the mqtt broker)
- port: 1883
- protocol: mqtt V5
- client id: (you can leave it empty, it will be generated automatically)
- keep alive: 60
- clean session: true
- Action: subscribe to a single topic
- Topic: gardening/chirp1 (the topic where the ESP32 will publish the data)
QoS: 2
- Retain message handling: send retained message
- Output: auto-detect(parsed JSON object, string or buffer)
- Name: (whatever you want)
We can move to the influxdb out node. Double click on it to open the configuration window. In there, we will set the following parameters:
- Name: (whatever you want)
- Server: click on the pencil icon to add a new server
- URL: http://influxdb:8086 (the container name of the influxdb database)
- version: 2.0
- token: We will set this up in a minute
- Organization: The organization we set up for influxdb in the docker-compose file
- Bucket: The bucket we set up for influxdb in the docker-compose file
- Measurement: (whatever you want, e.g. soil_moisture)
As you can see, we will need to set up a token for influxdb.
Finally the debug node. Double click on it to open the configuration window. In there, we will set the following parameters:
- Name: (whatever you want)
- Output: msg.payload
Our goal is simply to get the message directly in node-red to see what is going on.
influxdb
Now let’s set up influxdb. We can connect to the influxdb UI by going to http://YOUR_SERVER_IP:8086
You should probably get to a login page. Use the credentials you set up in the docker-compose file to log in.
I’ll let you explore the UI by yourself later (Check if your bucket and organization are created properly). But for now we need to create a token for Node-RED to be able to write data to the database.
Go to the “Data” tab (the arrow pointing up) on the left side menu, then select “API Tokens”. Click on “Generate API Token” and select “Read/Write Token”. In the next window, select the organization and bucket you set up in the docker-compose file. Finally give a name to your token and click on “Generate”. You will probably don’t need a full access token, so you can create a custom token with only write and read access to the bucket you created. Name the token “nodered-token” for example. Then copy the token, we will need it in Node-RED.
We can now go back to Node-RED and paste the token in the influxdb out node.
As we are here, we can also create a token for Grafana to be able to read data from the database. Go back to influxdb and create a new token with only read access to the bucket you created. Name the token “grafana-token” for example. Then copy the token, we will need it in Grafana.
grafana
TODO
(optional) ESPHome
TODO